How To Calculate Standard Deviation In Google Sheets
 Updated: October 18, 2021
 There are a number of functions that can calculate standard deviation in Google Sheets.
Which function to use depends on your data:
| A | B | C | |
| 1 | Sample | Population | |
| 2 | Non-numeric = ignored | =STDEV(A:A) | =STDEVP(A:A) |
| 3 | Non-numeric = 0 | =STDEVA(A:A) | =STDEVPA(A:A) |
Read on for a more detailed explanation.
Google Sheets allows you to quickly find the standard deviation of a data set.
It's actually quite a powerful tool to complete statistical analysis.
Before you can get the standard deviation, you need to ask yourself two questions about your data:
- Is your data a sample or a population?
- How do you want to handle non-numeric data (e.g. text and Boolean)?
If you've already answered these questions, you can skip to the functions or example calculation.
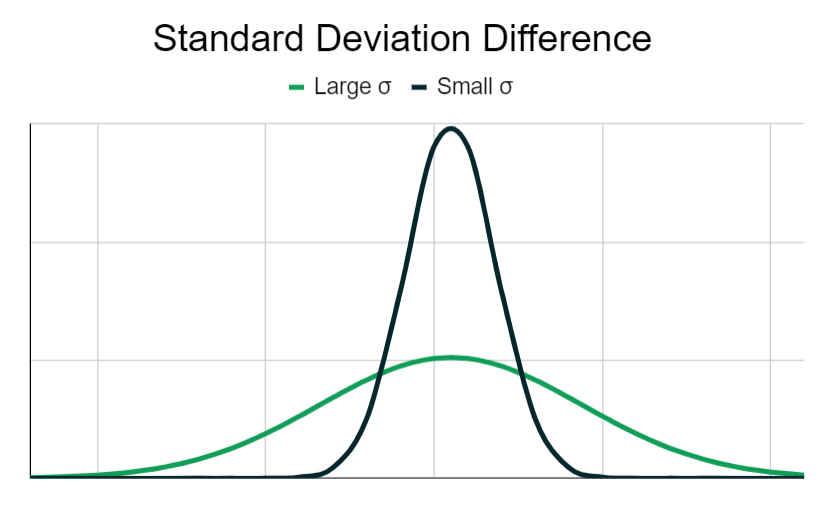
A data set's standard deviation simply indicates how much each data point deviates from the mean (the average).
A larger standard deviation means the data points are more dispersed.
A smaller standard deviation means the data points group closely around the mean.
Question 1: Standard Deviation Of A Sample Or Population?
Standard deviation is calculated differently based on whether the data is a sample from a larger population or the entire population itself.
Here are a couple of examples to clarify the difference between a sample and a population:
A school year group of 150 students sits a 100-question multiple choice test.
A teacher at this school has access to only the results of their 30 students.
The teacher wants to calculate:
- The standard deviation of their class
- The standard deviation of the year group
For the standard deviation of the class, the teacher should use the population standard deviation equation.
Why?
Because the teacher has access to all of the relevant data points. None are being left out.
For the standard deviation of the year group, the teacher should use the sample standard deviation equation.
Why?
Because the teacher has access to only 30 of the 150 results. They have a sample of a larger population and some data points from the population will be excluded from the calculation.
Here's the difference between the equations:
Sample Standard Deviation Equation
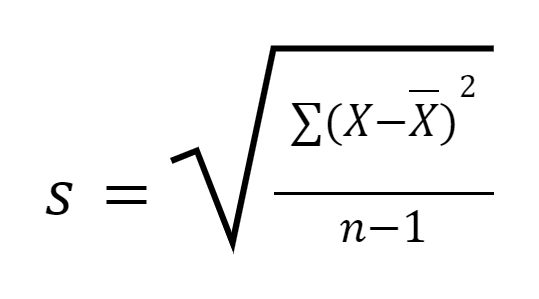
Where:
- s = Sample standard deviation
- Σ = The sum of…
- X = Each data point in the sample
- X̄ = Sample mean (average)
- n = Number of data points in the sample
Population Standard Deviation Equation
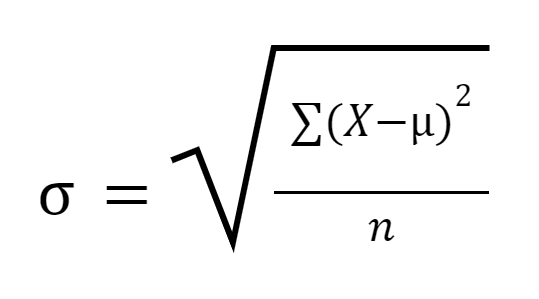
Where:
- σ = Population standard deviation
- Σ = The sum of…
- X = Each data point in the population
- μ = Population mean (average)
- n = Number of data points in the population
Essentially: When you're calculating the standard deviation of a population you divide by n and when it's a sample you divide by n-1.
Google Sheets has functions for both of these equations.


FREE RESOURCE
Google Sheets Cheat Sheet
12 exclusive tips to make user-friendly sheets from today:
You'll get updates from me with an easy-to-find "unsubscribe" link.
Question 2: Handling Non-Numeric Data
Standard deviation functions only work with numbers.
If there is non-numeric data in your set, you need to tell Google Sheets what to do with it.
These non-numeric values (e.g. text or Boolean data) can be:
- Ignored (treated as a blank cell)
- Included in the calculation as zero (0)
From the example above with the teacher, students who weren't at school when the test took place are included in the data set with "Absent" listed as their result.
The teacher would want this text to be ignored, otherwise the standard deviation would increase significantly because a number of students would register a score of zero when in reality they haven't taken the test yet.
How To Calculate Standard Deviation In Google Sheets
Now that you've answered the questions above you can use this table to determine which function you should use:
| A | B | C | |
| 1 | Sample | Population | |
| 2 | Non-numeric = ignored | =STDEV(A:A) | =STDEVP(A:A) |
| 3 | Non-numeric = 0 | =STDEVA(A:A) | =STDEVPA(A:A) |
For the STDEV and STDEVP functions, you can also use STDEV.S and STDEV.P (respectively).
This notation actually makes things clearer as the letter after the period immediately indicates whether the function calculates the standard deviation or a Sample or Population.
All of the formulas work the same:
- value1 = value, cell reference, or range reference
- [value2, ...] = [optional] additional arguments (as many as required)
Simply provide your data as arguments and get the relevant standard deviation returned.
It's best to stick to either arguments as references or values instead of a mix of both.
Why?
Two reasons:
1. Text from cell and range references is ignored (or treated as 0) but including text arguments directly like:
Throws the following error:
Function STDEV parameter 1 expects number values. But 'text' is a text and cannot be coerced to a number.
2. Another odd behaviour is that the STDEV and STDEVP functions ignore Boolean values in cell and range references but not when entered as arguments directly.
You need to provide at least two numbers as arguments.
If you don't you will get a #DIV/0! error:
Evaluation of function STDEV caused a divide by zero error.
Example Standard Deviation Calculation In Google Sheets
Here's a the results from a class of 10 from the school example described above:
| A | B | |
| 1 | Student | Result |
| 2 | Darrel | 86 |
| 3 | Sylvia | 43 |
| 4 | Doris | 44 |
| 5 | Samantha | 70 |
| 6 | Adrian | Absent |
| 7 | Oliver | 76 |
| 8 | Brianna | 99 |
| 9 | Clare | 97 |
| 10 | Quentin | 71 |
| 11 | Ramona | 68 |
Here are the standard deviation outputs for the various formulas available:
| A | B | C | D | |
| 1 | Student | Result | Formula | Output |
| 2 | Darrel | 86 | =STDEV(B2:B11) | 20.02498439 |
| 3 | Sylvia | 43 | =STDEVP(B2:B11) | 18.87973634 |
| 4 | Doris | 44 | =STDEVA(B2:B11) | 29.74035791 |
| 5 | Samantha | 70 | =STDEVPA(B2:B11) | 28.21418083 |
| 6 | Adrian | Absent | ||
| 7 | Oliver | 76 | ||
| 8 | Brianna | 99 | ||
| 9 | Clare | 97 | ||
| 10 | Quentin | 71 | ||
| 11 | Ramona | 68 |
Remember from earlier that for the standard deviation of the class itself the best option is STDEVP (18.87973634) while for the year group it's STDEV (20.0249843).
FREE RESOURCE
Google Sheets Cheat Sheet
12 exclusive tips to make user-friendly sheets from today:
You'll get updates from me with an easy-to-find "unsubscribe" link.
![COUNT Google Sheets Function [With Quiz]](https://kierandixon.com/wp-content/uploads/google-sheets-count-function.png)
![MINA Google Sheets Function [With Quiz]](https://kierandixon.com/wp-content/uploads/mina-function-google-sheets.png)